

Results and discussions
Fig. 3 presents fused multi resolution data based on HCS, HPF, MIHS and wavelet algorithms and the performance is evaluated through UIQI value (Table 2). All fusion except wavelets were heavy intensive process with 36 h of time on cloud computing networked systems. The results of fusion of multi resolution remote sensing data reveals that HCS performed better among the considered techniques.
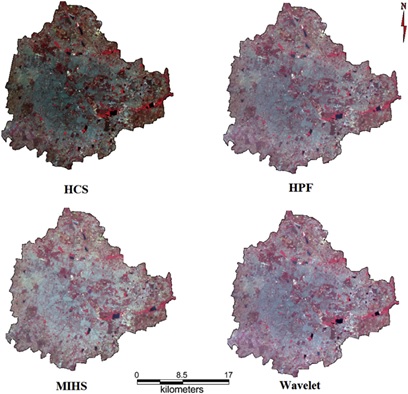
Fig. 3. Results of image fusion carried out to improve the image spectrally and spatially.
| Fusion techniques | Green | Red | NIR |
HCS |
1 |
0.98 |
0.98 |
MIHS |
1 |
0.96 |
0.78 |
HPF |
0.58 |
0.68 |
0.91 |
Wavelet |
0.89 |
0.94 |
0.98 |
Table 2 UIQI e band wise comparison for fused data to understand better fusion method for tree cover analysis.
Validation with field data apart from the visual evaluation and statistical analysis confirms that HCS performance is better for improving spatial details of MSS images while preserving the spectral properties.
Classification of land use using fused data as vegetation and non-vegetation was performed through Maximum Likelihood classifier. Results indicate the area of vegetation is about 14.08% (100 ha). Validation was performed based on field date collected through various samples. Accuracy assessment and kappa statistics was calculated based on validation image and classified image. Accuracy assessment shows an overall accuracy of 91.5% with kappa of 0.92.
Land use dynamics: Land use dynamics during the last four decades is illustrated in Fig. 5 and category wise land use changes are listed in Table 3. The city witnessed increase in built-up from 7.97% (in 1973) to 58.33% in 2012 (Ramachandra et al., 2012a,b; Bharath S et al., 2012). Industrialisation with push in IT and BT sectors witnessed large-scale rapid urbanization during post 90's.
The dense vegetation cover of 68.27% (in 1973) has declined to less than 25% (in 2012). Similar to vegetation, Water bodies have reduced from 3.4% (in 1973) to less than 1% impacting the ground water regime. Other land uses have speckled along the time frame from 20.35% in 1973 to 17.49% in 2012. Analysis of Tree distribution: Vegetation cover in the region was extracted from the classified land use information (Fig. 4). Overlaying administrative boundary of wards, on vegetation distribution aided in assessing ward wise vegetation cover (Fig. 7), which highlights that, minimum vegetation cover (<1 ha) in Chickpete, Shivajinagara, Kempapura agrahara, Padarayanapura, etc., while Varthur, Bellandur and Agaram wards had highest vegetation cover (of>300 ha). Ward wise vegetation density and distribution is as given in Fig. 5a and b, indicate that Hudi, Aramanenagara and Vasantha pura wards have highest vegetation density (>0.4) compared to Chickpete, Laggere, Hegganahalli, Hongasandra, Padarayanapura (<0.015). The spatial extent of vegetation cover in Bangalore is about 100.20 sq. km with vegetation density of 0.14. Fig. 6 gives the tree distribution in wards based on the field data of location wise tree species and canopy spatial extent. Species wise allometric models of canopy cover (Enquist et al., 2009; West et al., 2009) that specifically helps in predicting species specific intercepts was used to estimate trees in each ward. Based on the canopy size through allometric equations and number of tress mapped of trees.

Fig. 4. Land use dynamics of Silicon Valley of India. (For interpretation of the references to colour in this figure legend,
the reader is referred to the web version of this article.)
| Class | Urban | Vegetation | Water | Others | ||||
| Year | Ha | % | Ha | % | Ha | % | Ha | % |
1973 |
5448 |
7.97 |
46,639 |
68.27 |
2324 |
3.4 13 |
903 |
20.35 |
1992 |
18,650 |
27.3 |
31,579 |
46.22 |
1790 |
2.6 |
16,303 |
23.863 |
1999 |
24,163 |
35.37 |
31,272 |
45.77 |
1542 |
2.26 |
11,346 |
16.61 |
2006 |
29,535 |
43.23 |
19,696 |
28.83 |
1073 |
1.57 |
18,017 |
26.37 |
2012 |
41,570 |
58.33 |
16,569 |
23.25 |
665 |
0.93 |
12,468 |
17.49 |
Table 3 Temporal Land use dynamics of Bangalore from 1973 to 2012.
Fig. 5. a: Ward wise vegetation distribution in hectares. b: Ward wise vegetation density.
Fig. 6. Tree canopy size distribution based on field measurements in pilot study of various wards.
Wards such as Vathuru, Bellanduru, Agaram, Aramane nagara have >40,000 trees, while Chickpete, Padarayanapura, Shivaji nagara, Kempapura Agrahara, Kushal nagara wards have less than 100 trees. Ward wise aggregation shows that Bangalore city has about 1.478 million trees (Fig. 7a). Validation of tree estimate with eld data (collected from select wards) shows an accuracy of 97%. Ward wise tree per person (Fig. 7b), indicates the wards such as Shivaji nagara, Dayananda nagara, Chickpete, Padarayanapura, empapura Agrahara has very less number of trees per person (i.e., less than 1 tree for every 500 persons). Compared to this, Bellanduru, Jakkuru, Varthuru, Agaram, Aramane nagara has 1.25 trees per person. Trees per person details were compiled from literature highlight Gandhinagar city (Gujarat), Nashik city (Maharashtra) has a good number of trees per person i.e., Gandhinagar has 4 trees per person, Nasik 2 trees per person compared to one trees for 7 persons in Bangalore.
Fig. 7. a: Number of trees quantified in each ward. b: Ratio of trees per person in each wards considered.
